
BeZero Carbon
I’m a Product Designer at BeZero Carbon, where I turn complex carbon market data into clear, actionable experiences that help people make smarter climate decisions. BeZero is a carbon ratings agency giving organisations the tools and confidence to assess project risks, and my role bridges design, data science, and engineering to make that intelligence usable.
My focus is on simplifying data-heavy workflows and building systems that scale. I work closely with analysts, developers, and product teams to translate technical logic into intuitive visual frameworks from interactive risk dashboards to AI-powered inputs. Alongside this, I maintain our design system and component libraries, ensuring everything feels coherent and easy to evolve as the product grows.
I love the challenge of balancing usability with scientific accuracy, finding ways to make something deeply technical feel effortless and human.
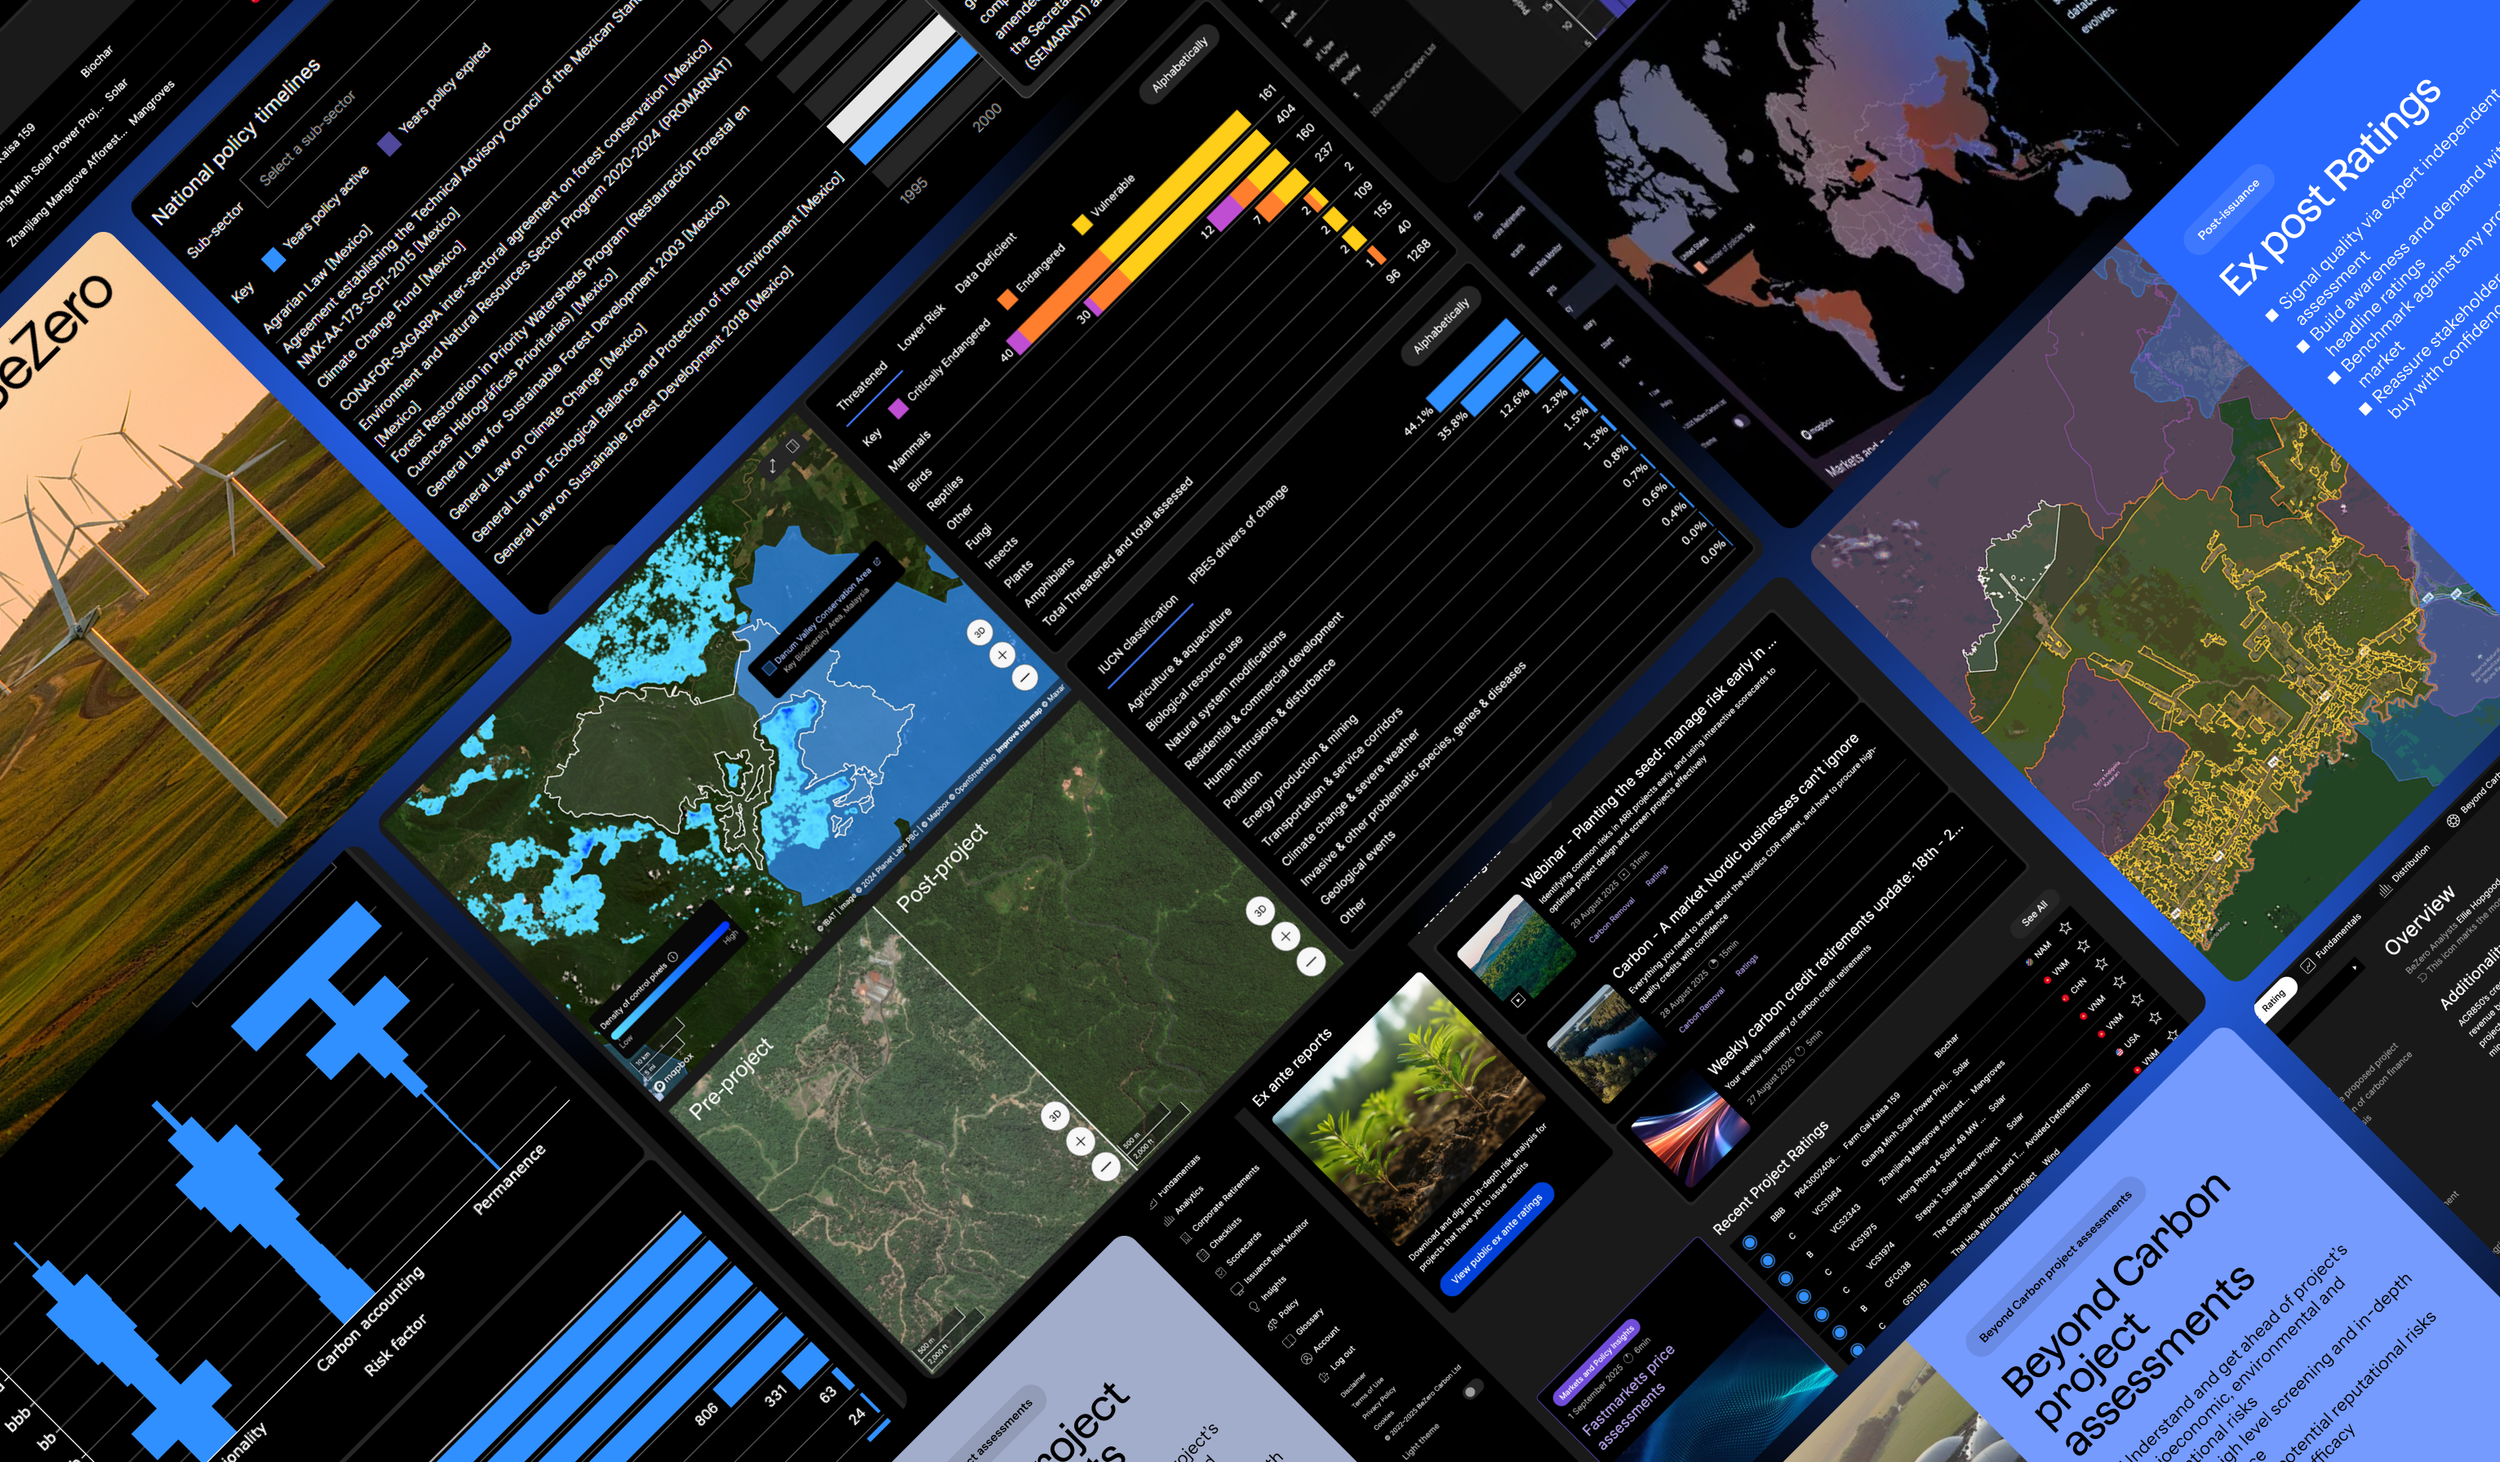
Interface concepts from BeZero’s data tools simplifying multi-layered risk and policy data into visual systems that enable faster, more confident climate decisions.
VERSION 1
A strong idea that didn’t land
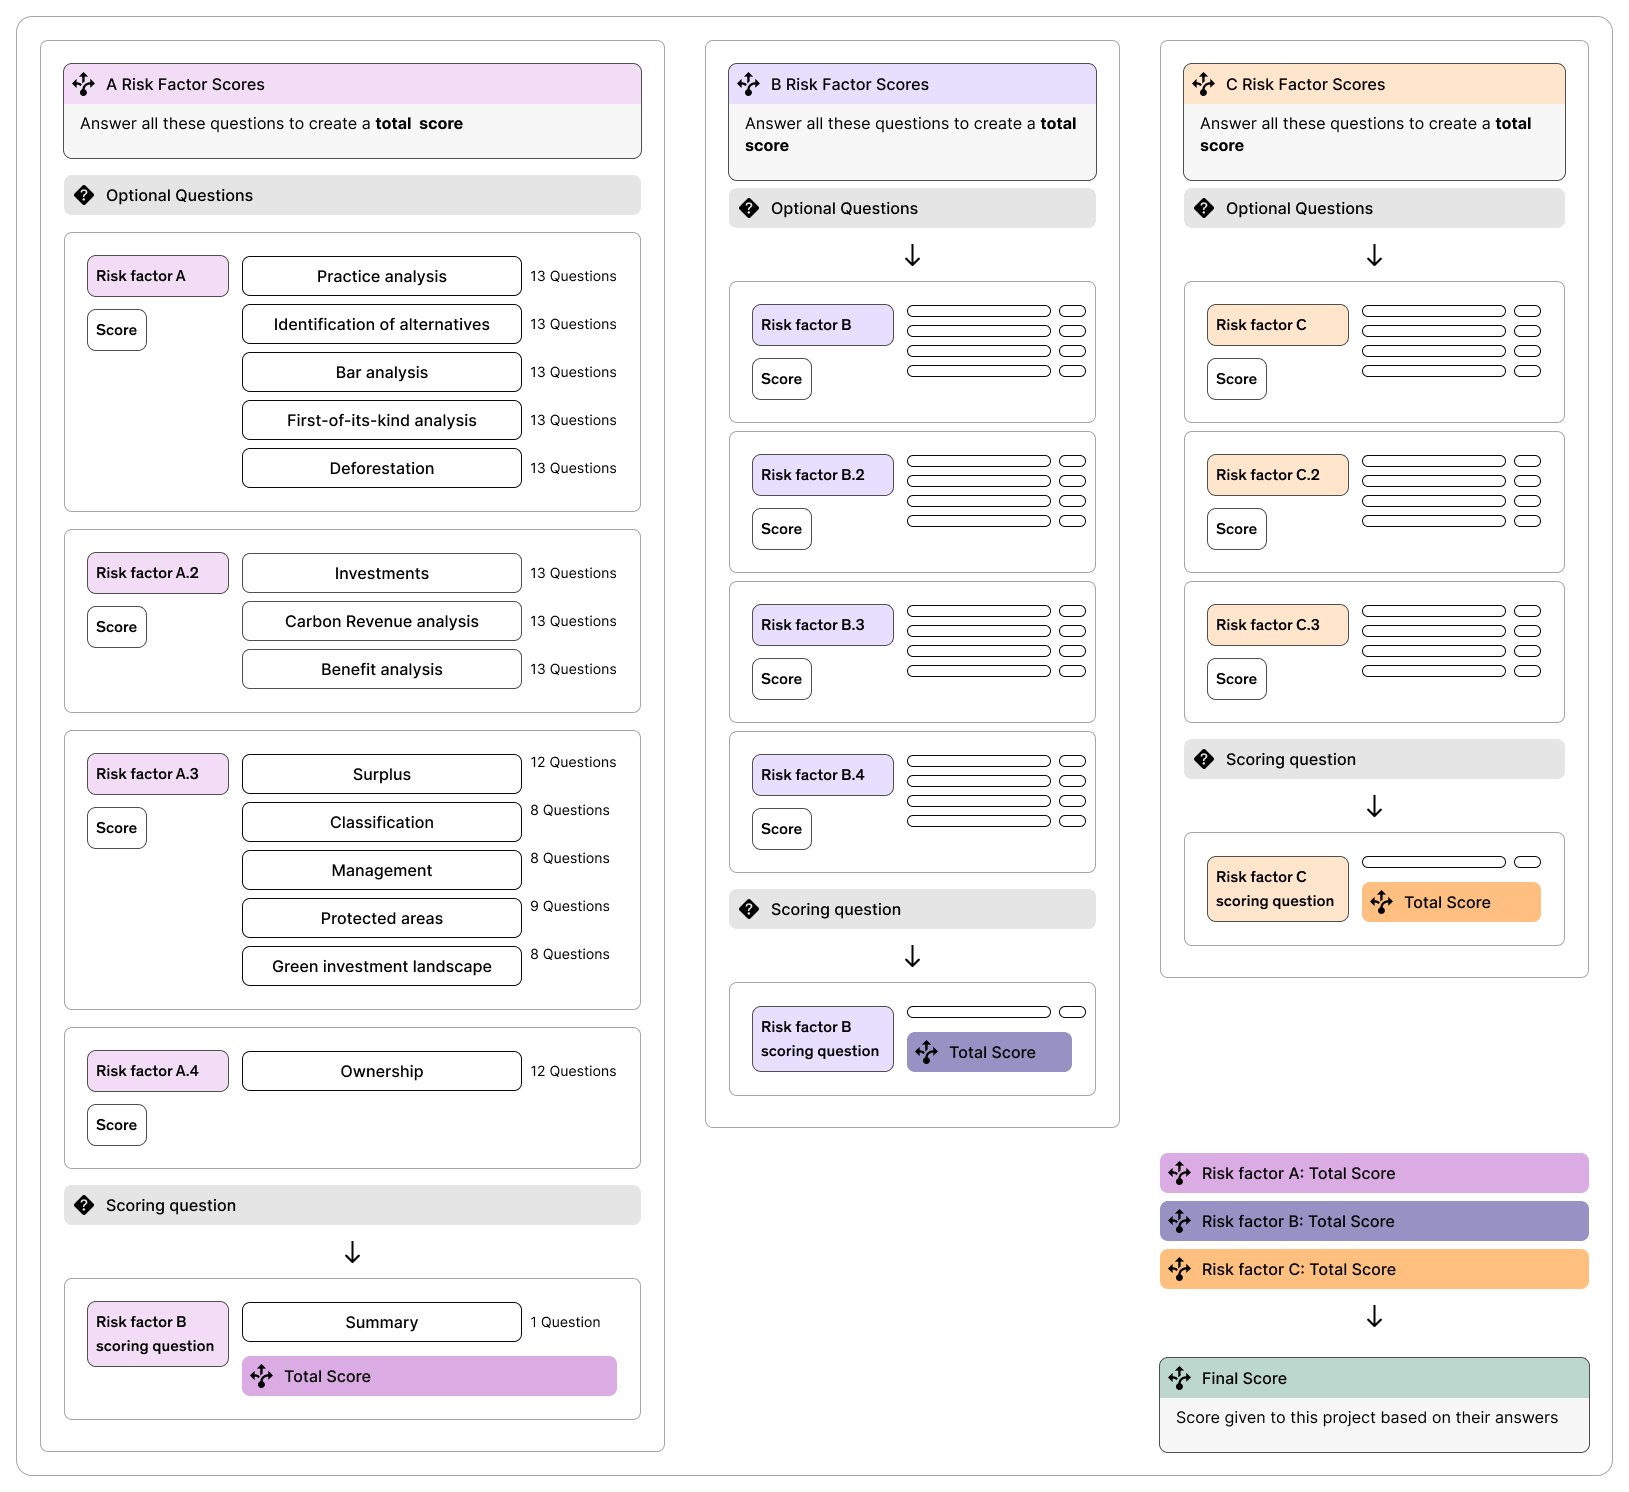
The first version of the Scorecard Tool was built to mirror how analysts think.
It broke projects into three major risk factors: Additionality, Carbon Accounting, and Permanence. Each had layers of sub-factors and dozens of questions. Users could also apply their own weightings to tailor the scorecard to the project they wanted to assess. It looked great in theory: transparent, structured, and comprehensive. But in practice, it was too much.
It took hours to complete, and even experienced users found it confusing. The hierarchy was heavy, the scoring logic was hard to follow, and the whole process felt like sitting an exam. Users found the structure intuitive for moving through sections and understanding the framework, but locating specific questions and interpreting the hierarchy required extra effort.
“We’d built something that captured expert logic perfectly, but forgot how humans actually work under time pressure.”
Challenge
Evaluating renewable energy projects sounds simple, but it isn’t. Each one comes with hundreds of pages of technical data and reports, yet the people responsible for making investment or due-diligence decisions often have less than an hour to decide if it’s worth exploring further.
This product had to be faster and easier to use. The idea was to build a tool that could take expert knowledge, the kind usually hidden in years of analyst experience and turn it into a guided, self-service workflow.
Due Diligence Specialist, Carbon Markets
“The logic behind the framework makes complete sense, but in practice it’s too heavy. I want to focus on the outliers, not go through every sub-question manually”
Investor, Climate Fund
“The weighting system is useful in theory, but adjusting it section by section becomes tedious when I’m just trying to get to an indicative view.”
We realised we didn’t need a bigger tool, we needed a smarter one.
The first version worked in theory but not in practice. It was too detailed, too slow, and too difficult for non-experts to use confidently. Even with strong UX, the experience was heavy: hundreds of nested questions, complex logic, and hours of work.
Senior Risk Analyst, Investment Firm
“I can see how the hierarchy maps to the rating framework, but when I’m working across multiple projects, I just need the critical questions that actually move the score.”
Carbon Market Consultant
“Completing one Scorecard is fine, but scaling this to ten or twenty projects a week isn’t realistic. I need something that gives directional confidence faster.”
Senior Risk Analyst
“It’s impressive, but not scalable. The market moves quickly, and I can’t afford a tool that takes two hours to produce a directional signal.”
Senior Risk Analyst
There’s a lot of depth here, but the interface doesn’t help me prioritise. Every question feels equally weighted visually, so I can’t tell what’s driving the outcome.”
BACK TO THE DRAWING BOARD
The pivot

DEFINE
What I learnt from user research
Through surveys and extensive user testing, it became clear that the scoring model itself needed to evolve. We simplified the logic so that scoring would only happen at the sub-factor level, using a handful of essential questions rather than dozens
From a product perspective, this change worked for everyone. It made engineering simpler, reduced confusion for users, and allowed the tool to scale across different project types.
Complexity isn’t clarity. The more detail we added, the harder it became to use.
Speed matters most. People wanted a quick, directional answer, not a dissertation on carbon efficacy.
Personas drive design. Many users weren’t analysts; they just needed something fast and clear.
Reactions to the score and weighting features were mixed. Some users valued the flexibility, while others ignored it. There was stronger demand for practical features like saving progress, downloading results, and having an in-context glossary. Overall, participants wanted less complexity and more guidance within the tool.
Before redesigning, it was important to understand who we were really building for. While the Scorecard was designed to serve a wide range of people in the carbon market, their needs and goals were very different.
Levi Risk Analyst
Levi represents the analytical user who values transparency and accuracy. He needs to see not just the score, but how it was formed. The focus on clear logic, step-by-step structure, and visible scoring inputs was key to making the Scorecard trustworthy for people like him.
Max Project Developer
Max works closely with project data and design. He uses the Scorecard to test ideas and understand how different decisions affect risk and potential impact. For him, the tool needed to be practical and educational — a way to refine design choices without relying on deep technical expertise.
Mira Portfolio Manager
Mira benefits from the outputs rather than the process. She might not fill out the Scorecard herself, but she uses the scores to compare and prioritise projects. The exportability, summaries, and confidence levels were built with her in mind.

VERSION TWO
